Product Infographic
Product Infographic Selling Point Infographic Feature Infographic Feature Diagram Selling Point Image Callout Image
E-commerce VisualsA visual format in e-commerce used to intuitively display a product's core functions, material details, or technical parameters, combining text and image layout to transform abstract selling points into a visual information hierarchy.
Also known as: Selling Point Infographic · Feature Infographic · Feature Diagram · Selling Point Image · Callout Image
- Midjourney
- Flux
- Dreamina
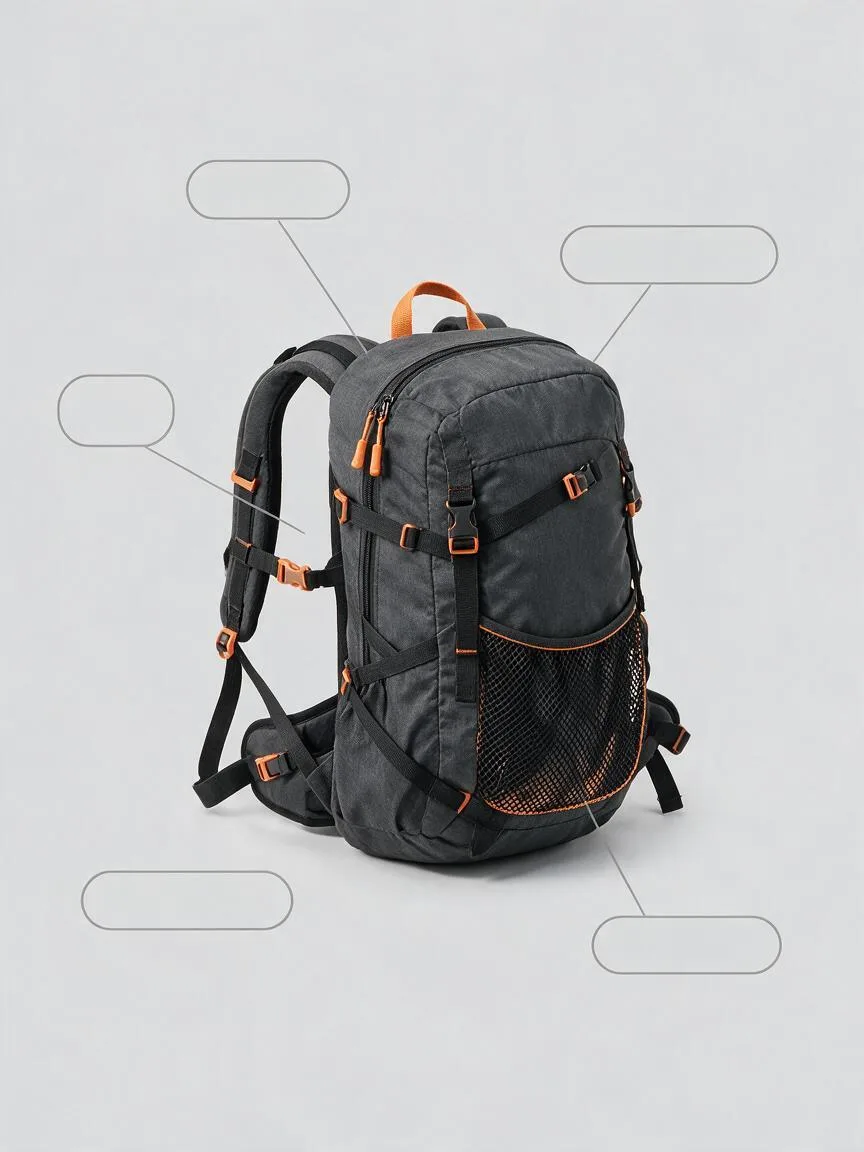
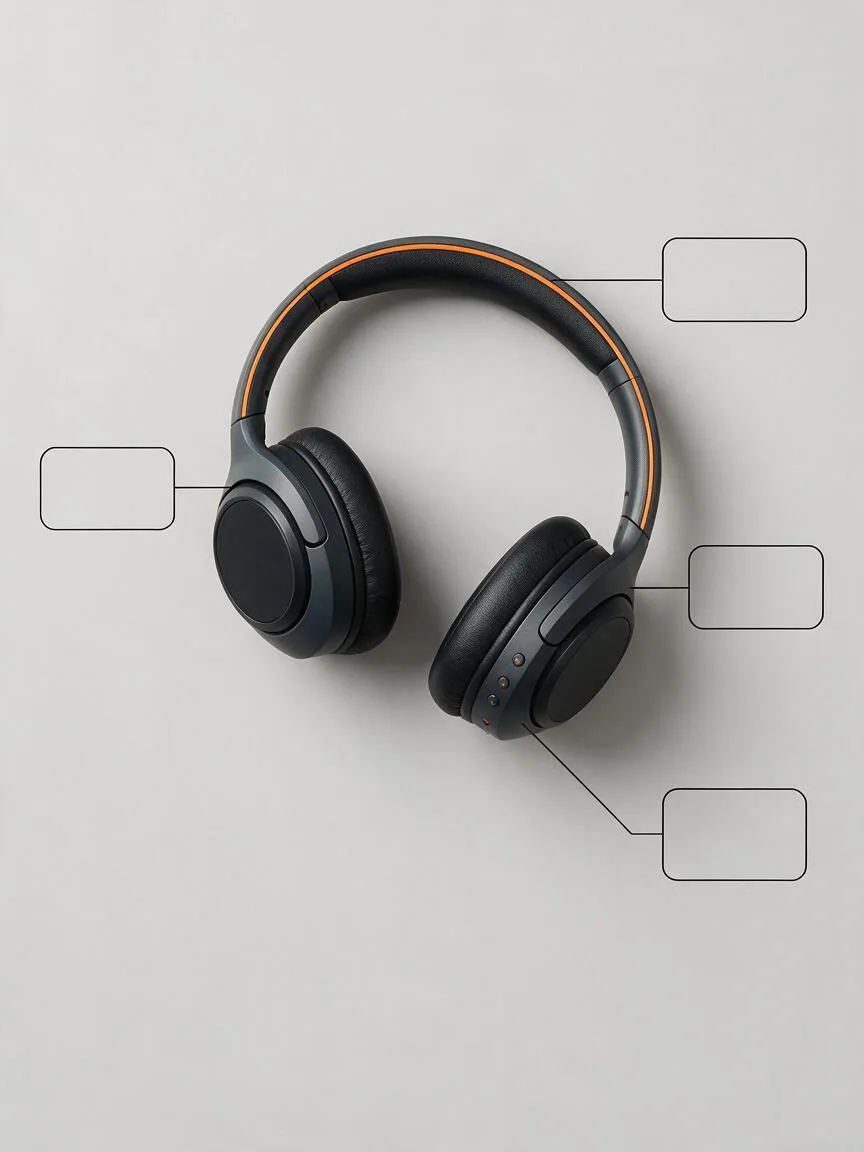
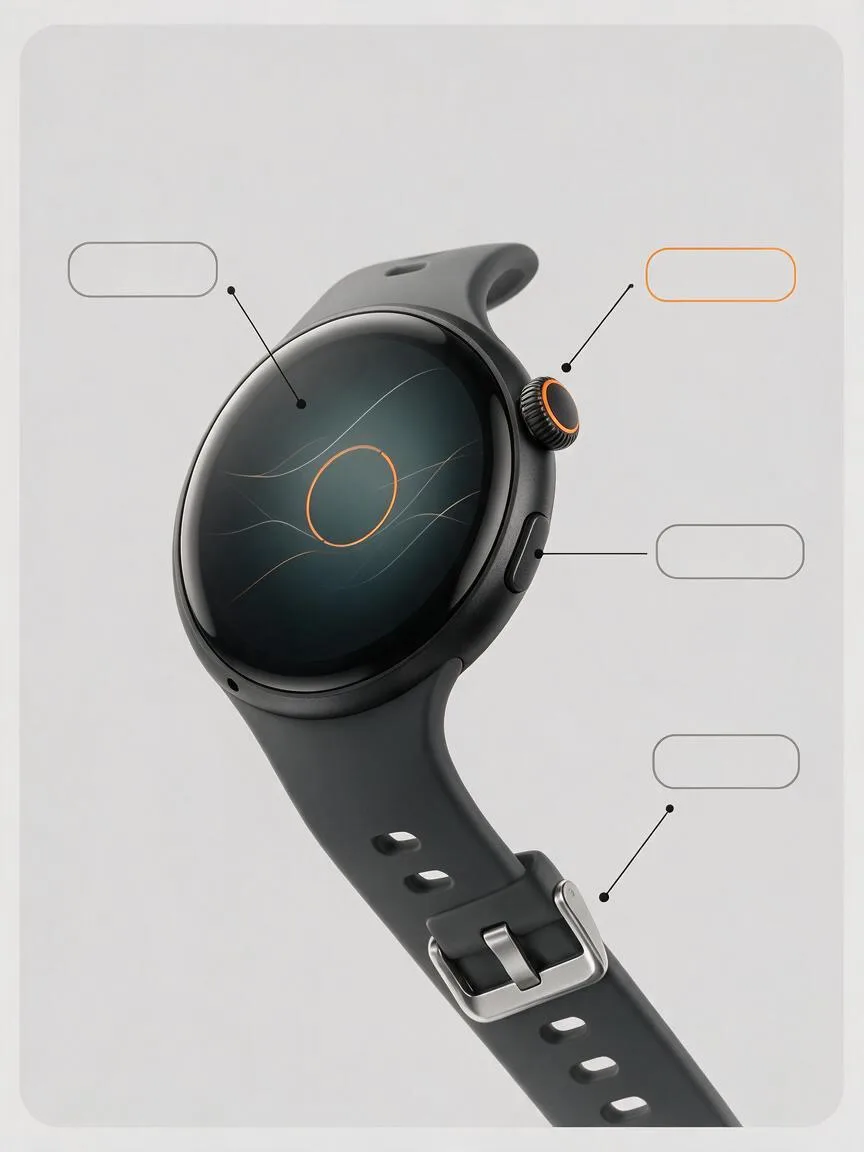
Prompt snippets
product feature infographic base image for a hiking backpack, the backpack at a three-quarter angle on a light grey background, four thin leader lines run from the straps, zipper, side pocket and back panel to empty rounded label boxes around it, wide empty margins, soft even light, restricted palette of grey, black and one orange accent, no text, no letters, no numbers --ar 1:1 --style rawA base image for a product feature infographic: a hiking backpack at a three-quarter angle on a light grey background. Four thin leader lines run from the straps, the zipper, the side pocket and the back panel to empty rounded label boxes around it. Wide empty margins, soft even light, a restricted palette of grey, black and one orange accent. No text, no letters, no numbers.Base image for a product feature infographic: a hiking backpack at a three-quarter angle on a light grey background. Four thin leader lines run from the straps, the zipper, the side pocket and the back panel to empty rounded label boxes around it. Wide empty margins, soft even light, a restricted palette of grey, black and one orange accent. No text, no letters, no numbers.
How this look is built
Open in the builder ›An ad look is not one style word but the combination below. Opening it fills the matching slots; the subject is yours to write.
- CompositionNegative SpaceLeave space around the product for leader lines and copy, so the selling points can be properly laid out.
- StyleMinimalismThe cleaner the background, the easier the callouts are to read.
- LightingSoft LightEven, soft lighting ensures every highlighted part is clearly visible.
- ColorLimited Color PaletteUse grey and black with one accent color, reserving the accent color for the callouts themselves.
What it is
A Product Infographic is a visual format in e-commerce used to intuitively showcase a product’s core functions, material details, or technical parameters. It typically uses the product as the main subject, combining callout lines, magnified details, icons, and concise copy to transform abstract selling points into a visual information hierarchy, reducing the cognitive load for consumers.
Visual and emotional effect
Visually, it presents a high sense of order and professionalism, guiding the eye through clear typography and contrasting colors. Emotionally, it conveys a rational, reliable, and transparent brand attitude, effectively building consumer trust in product quality and technical capability, and facilitating quick decision-making.
When to use it
Suitable for categories with strong functional attributes that require explaining working principles or emphasizing special materials, such as consumer electronics, home appliances, beauty and skincare, and outdoor gear. It is commonly used in the core selling point modules of a Product Detail Page, the second to fifth carousel images of a Main Product Image, and as long-form product educational graphics on social media.
Prompt tips
It is difficult for AI to directly generate a complete infographic with accurate text and complex layouts. It is recommended to adopt a “base image generation + post-production layout” workflow. Prompts should focus on the product’s texture, lighting, and the Negative Space suitable for adding callouts. For example, specify a clean background, use a Close-up for local details, or use an Exploded View style to show internal structures.
Common mistakes
Trying to use AI to generate a complete infographic with a large amount of accurate text and complex data charts in one go often leads to garbled text and messy layouts. The core of a Product Infographic lies in “information design” rather than pure “image generation.” AI should be used as a tool to extract high-quality visual assets, while text and charts should be completed in design software.